Project Overview
Next Gen is a complete learning management system dashboard for schools, training centers, and online course providers. It helps admins track course progress, student enrollment, revenue, and teacher performance all in one place. The dashboard shows real time analytics with charts and graphs so you never have to guess how things are going.
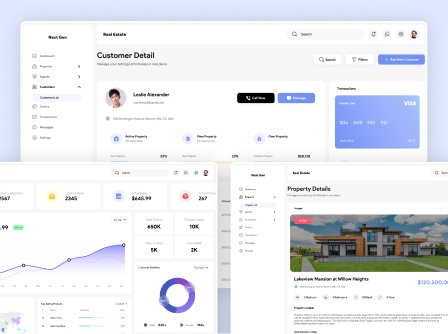
When you open Next Gen you see the left panel first. Dashboard is at the top followed by Courses, Students, Enrolment, Messages, Admin profile, and Settings. Everything is organized so you can jump anywhere in one click.
The main content area has big numbers. Total students shows plus two thousand five hundred sixty seven this month. Total revenue shows six hundred forty five dollars ninety nine cents for last month. Total courses shows plus two hundred fifty seven this month. Average enrollment rate has a graphical representation with eighty percent in blue and twenty percent in orange. The graph goes from zero to one hundred percent on the Y axis and shows months from January to December on the X axis.
The top five courses table shows everything you need. Course date, instructor name, number of users, enrolled amount, and price. For example October thirtieth with Faculty Miles showing five hundred users and fifty dollars and ten thousand enrolled. You see all five rows clearly with instructor names like Remote Coach and Trevose MES. Top categories are listed on the side. Web Development, Design Thinking, UI UX Design, Data Science, and AI Tools. These are the most popular subjects on the platform so you know where to focus your marketing. The right panel has analytics overview. Student progress shows a student name, current score at eighty three percent, target score at ninety percent, and goal achievement at seventy percent. Top teachers section shows teacher name, class name, five hundred enrolled, and fifty dollars price.
Top courses section in the analytics panel shows course name, total students at eight thousand three hundred twenty four, total revenue at twelve hundred dollars, and total cost at four hundred fifty dollars. This helps you see which courses are actually making money. Everything updates in real time. When a new student enrolls or a course is added, the numbers change. Charts show trends so you can see if enrollment is going up or down compared to last month or last year. This is built for people who run real education businesses and need real data to make decisions.